Statistics
University-wide study abroad statistics
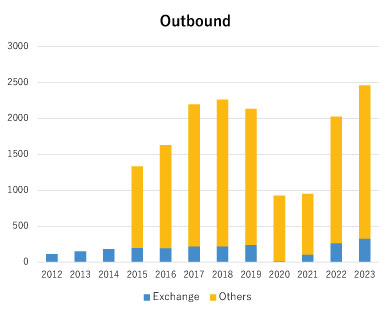
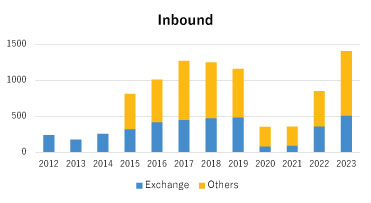
International Mobility of Students at the University of Tokyo (The number of students sent abroad/the number of students accepted from abroad)
The terms “outbound” and “inbound” here refer to students emporarily leaving their home university to participate in a non-degree study abroad program at a partner university.
- Outbound students: Students sent abroad for a short period of time (one year or less) from UTokyo for exchange programs, summer programs, etc.
- Inbound students: Students from abroad who are accepted to UTokyo for a short period of time (one year or less) through exchange programs, summer programs, etc.
| Year | 2015 | 2016 | 2017 | 2018 | 2019 | 2020 | 2021 | 2022 | 2023 | 2024 | |
|---|---|---|---|---|---|---|---|---|---|---|---|
| Outbound | Exchange | 199 | 197 | 220 | 221 | 240 | 15 | 107 | 266 | 329 | 380 |
| Others | 1,133 | 1,430 | 1,978 | 2,040 | 1,811 | 910 | 846 | 1,762 | 2,131 | 2,379 | |
| Total | 1,332 | 1,627 | 2,198 | 2,261 | 2,051 | 925 | 953 | 2,028 | 2,460 | 2,759 | |
| Inbound | Exchange | 323 | 420 | 451 | 475 | 484 | 84 | 92 | 360 | 511 | 563 |
| Others | 488 | 589 | 820 | 775 | 677 | 270 | 266 | 489 | 895 | 1,322 | |
| Total | 811 | 1,009 | 1,271 | 1,250 | 1,161 | 354 | 358 | 849 | 1,406 | 1,885 |
Activities of GlobE
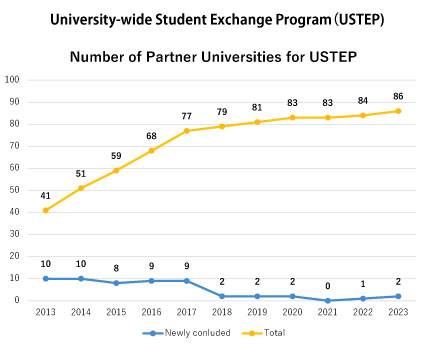
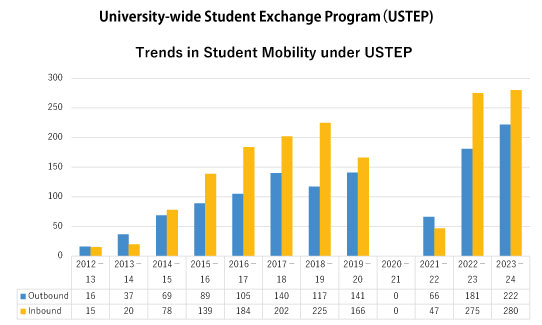
University-wide Student Exchange Program (USTEP)
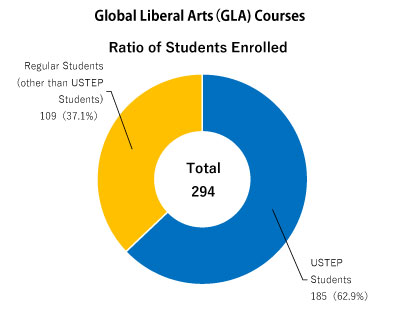
Global Liberal Arts (GLA) Courses
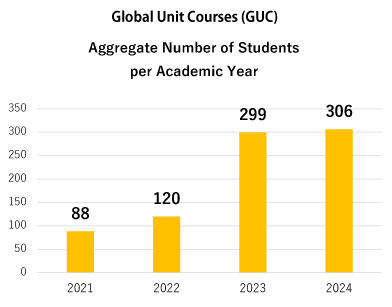
Global Unit Courses (GUC)